Work log reports allow you to track and analyze the working time and tasks performed by employees in your organization. They can be configured to present information according to selected criteria, for example, “the work log was created on a specific date”. This allows you to generate reports that include only work log entries associated with a specific day or specific dates, making it easier to focus on specific activities.
More about the work log: Go >
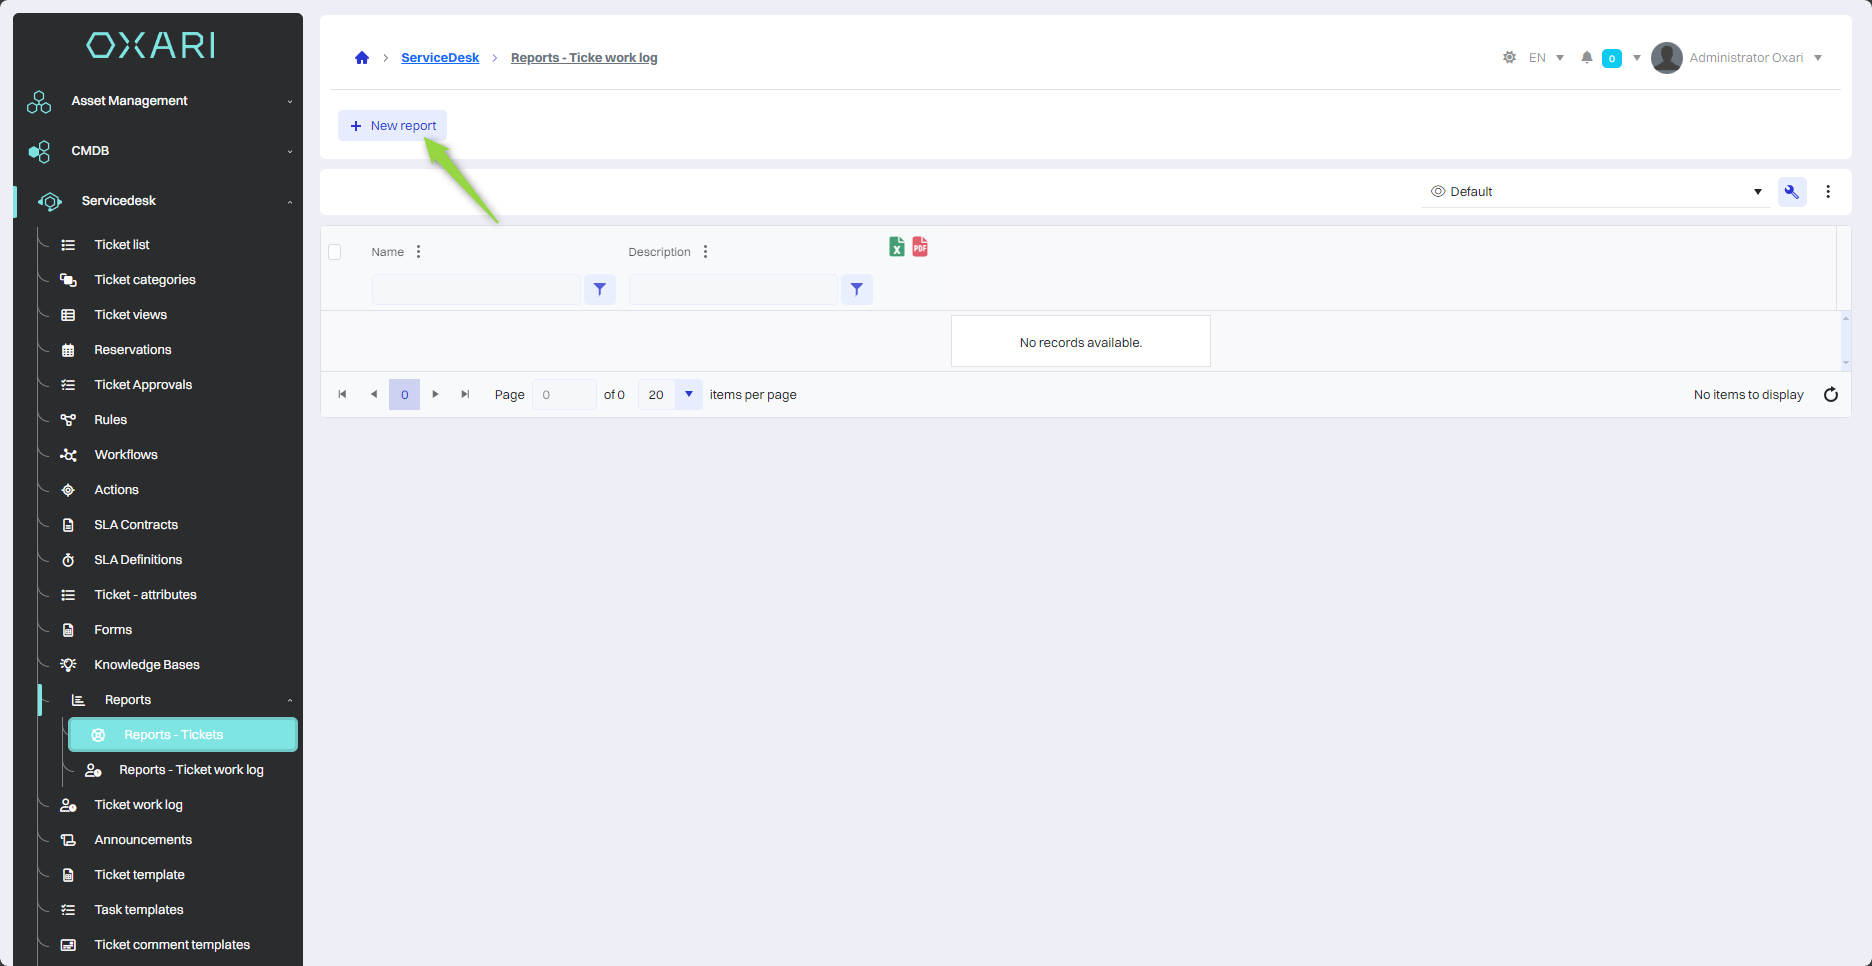
New report
To add a new report, go to Servicedesk > Reports - Work log, then click the “New report” button.
Filling in the basic data
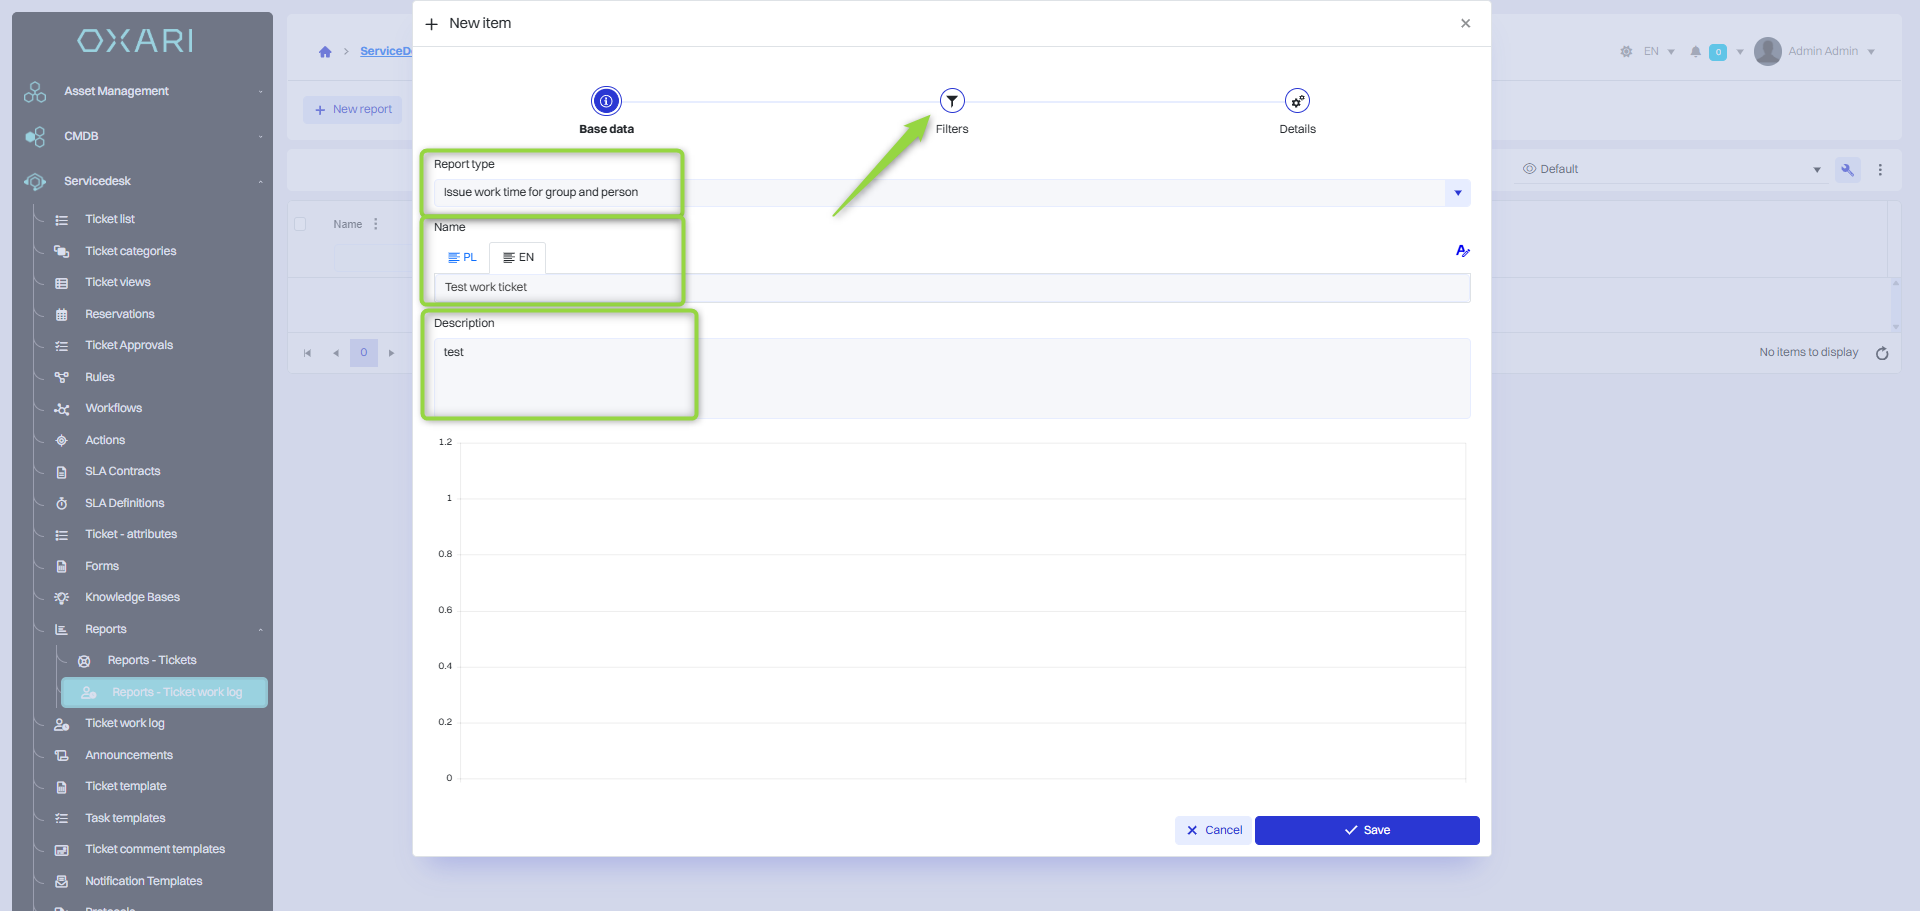
In this step, the basic data are filled in, the Report type is selected, the report is named and described, then click the “Filters” button.
Setting the report filters
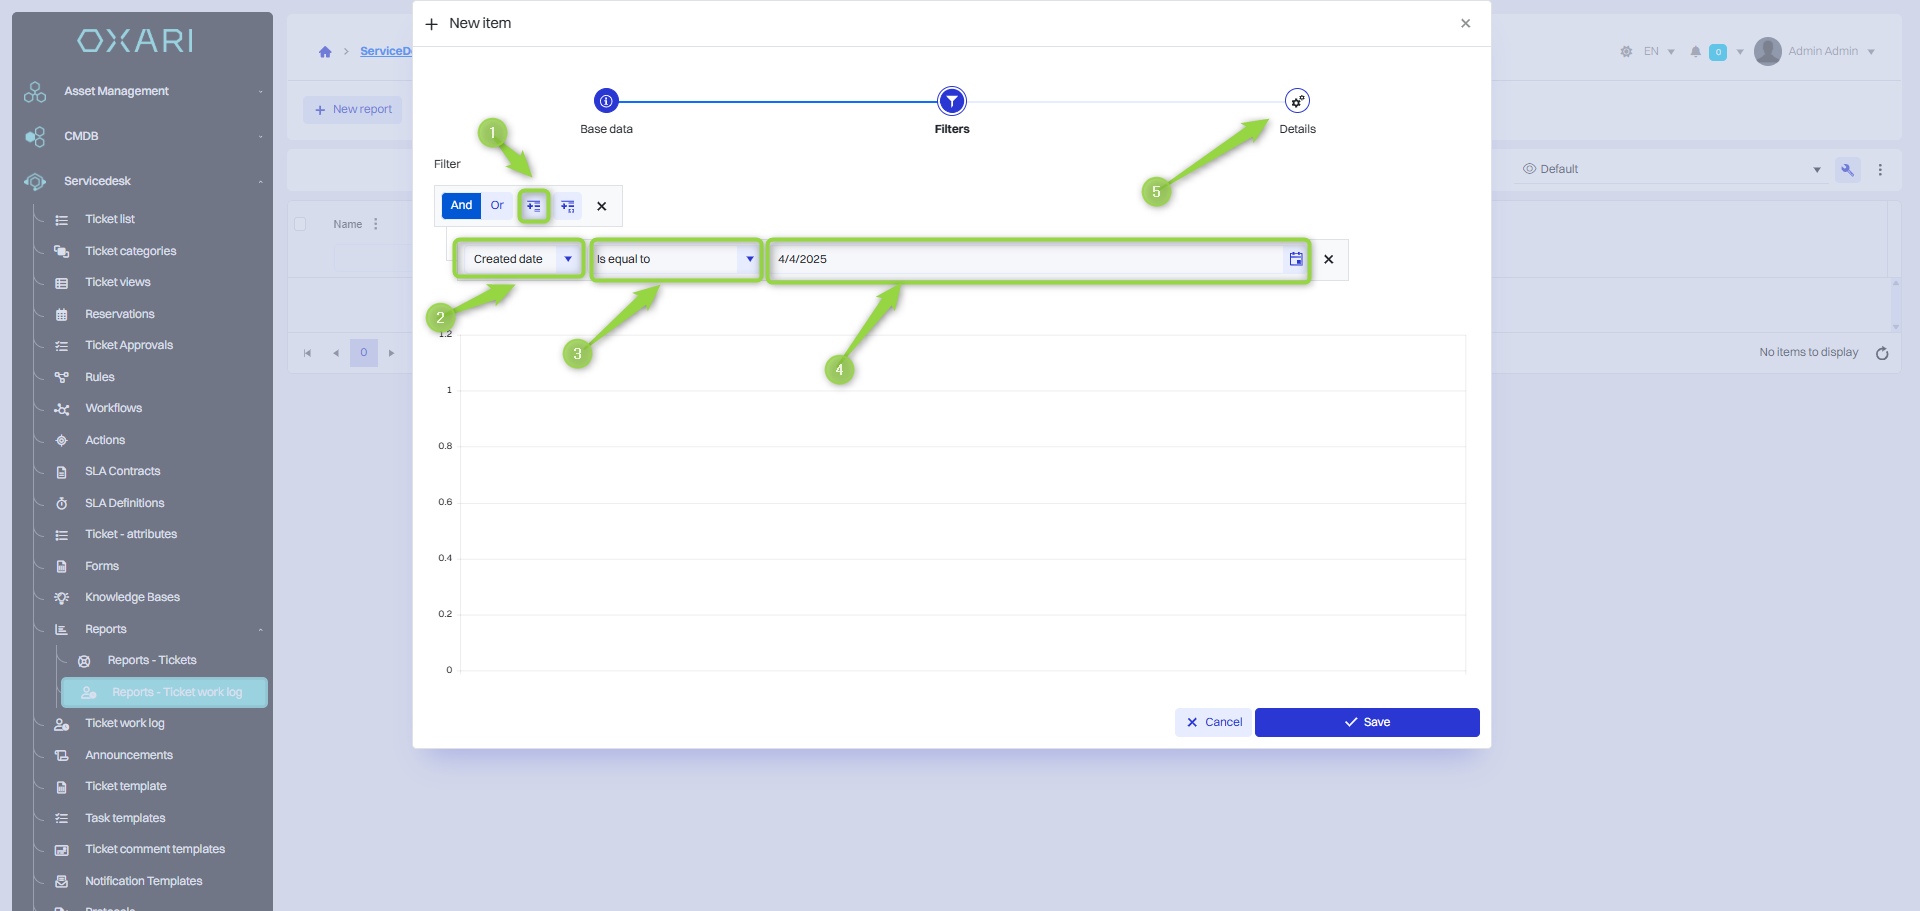
In this step, the report filters are established.
1. Click the “Add expression” button
2. Click in the field to set the filter (in this case “Created”).
3. The operator is selected (in this case “Equal”)
4. The date is selected (in this case “04.04.2025”).
5. The “Details” button must be clicked.
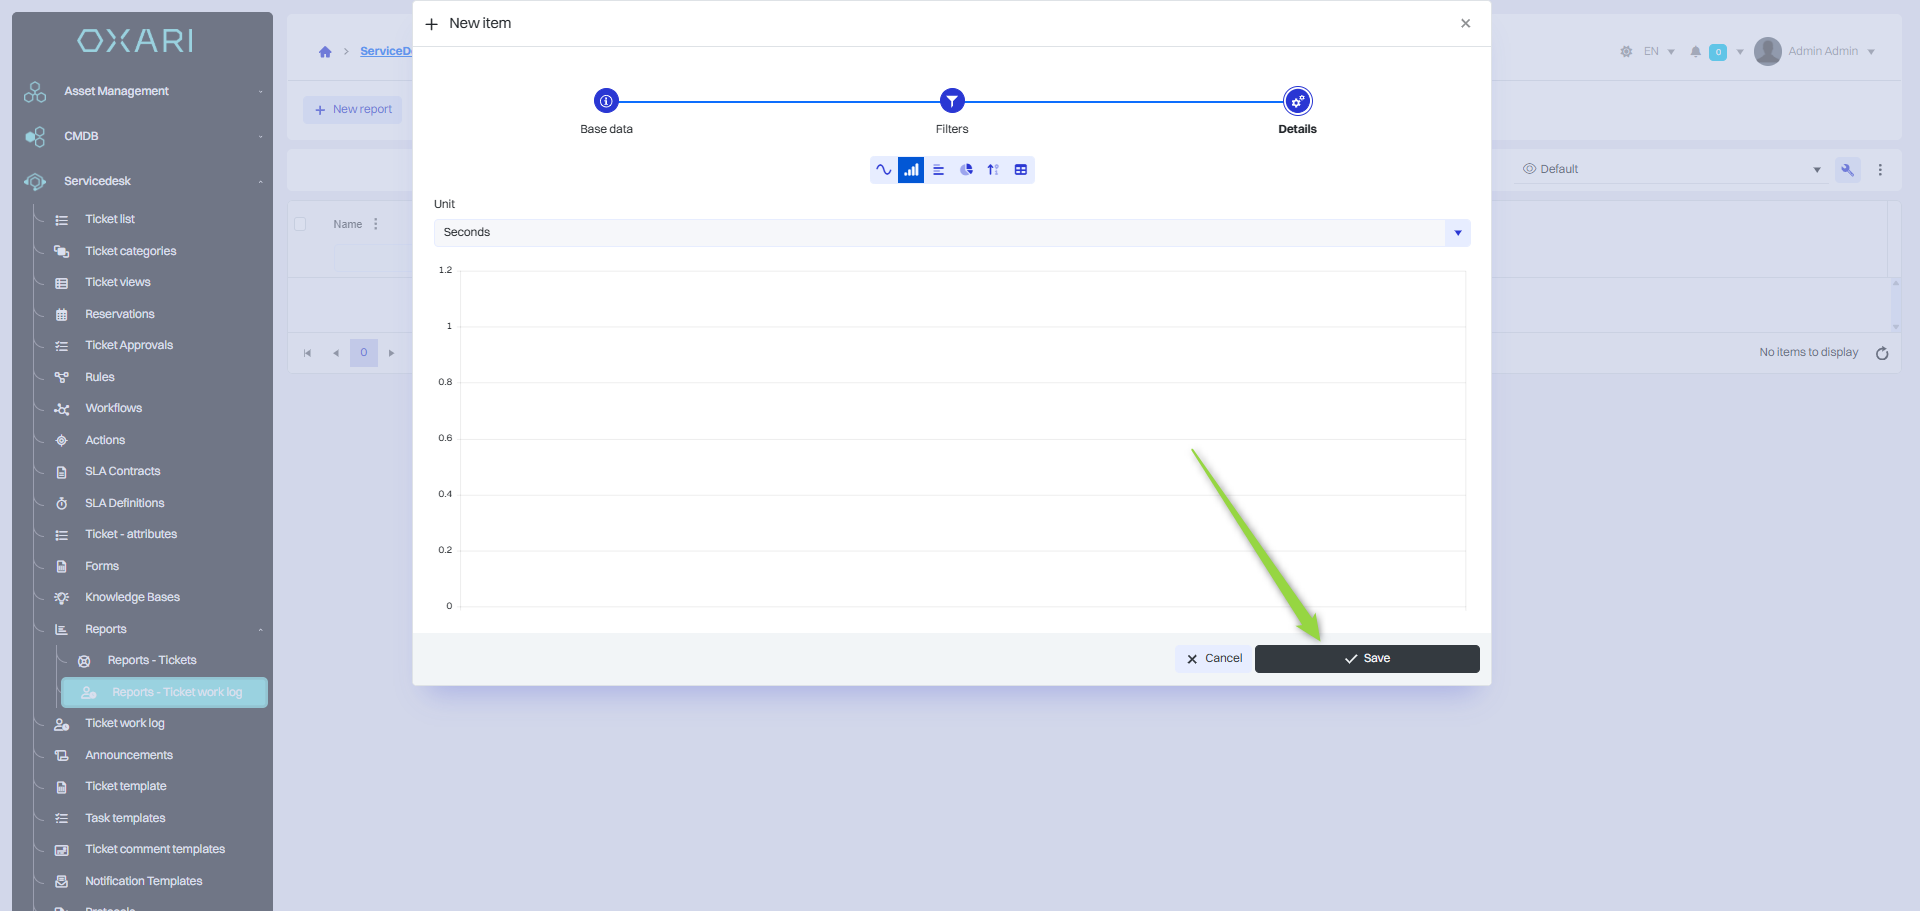
Determining the details of the report
Reports in the OXARI system can be presented in various data visualization formats, depending on the needs of analysis and presentation of information. Available formats are: Line chart, Column chart, Bar chart, Pie chart, Count, Tabular. Select the desired data and click the “Save” button.
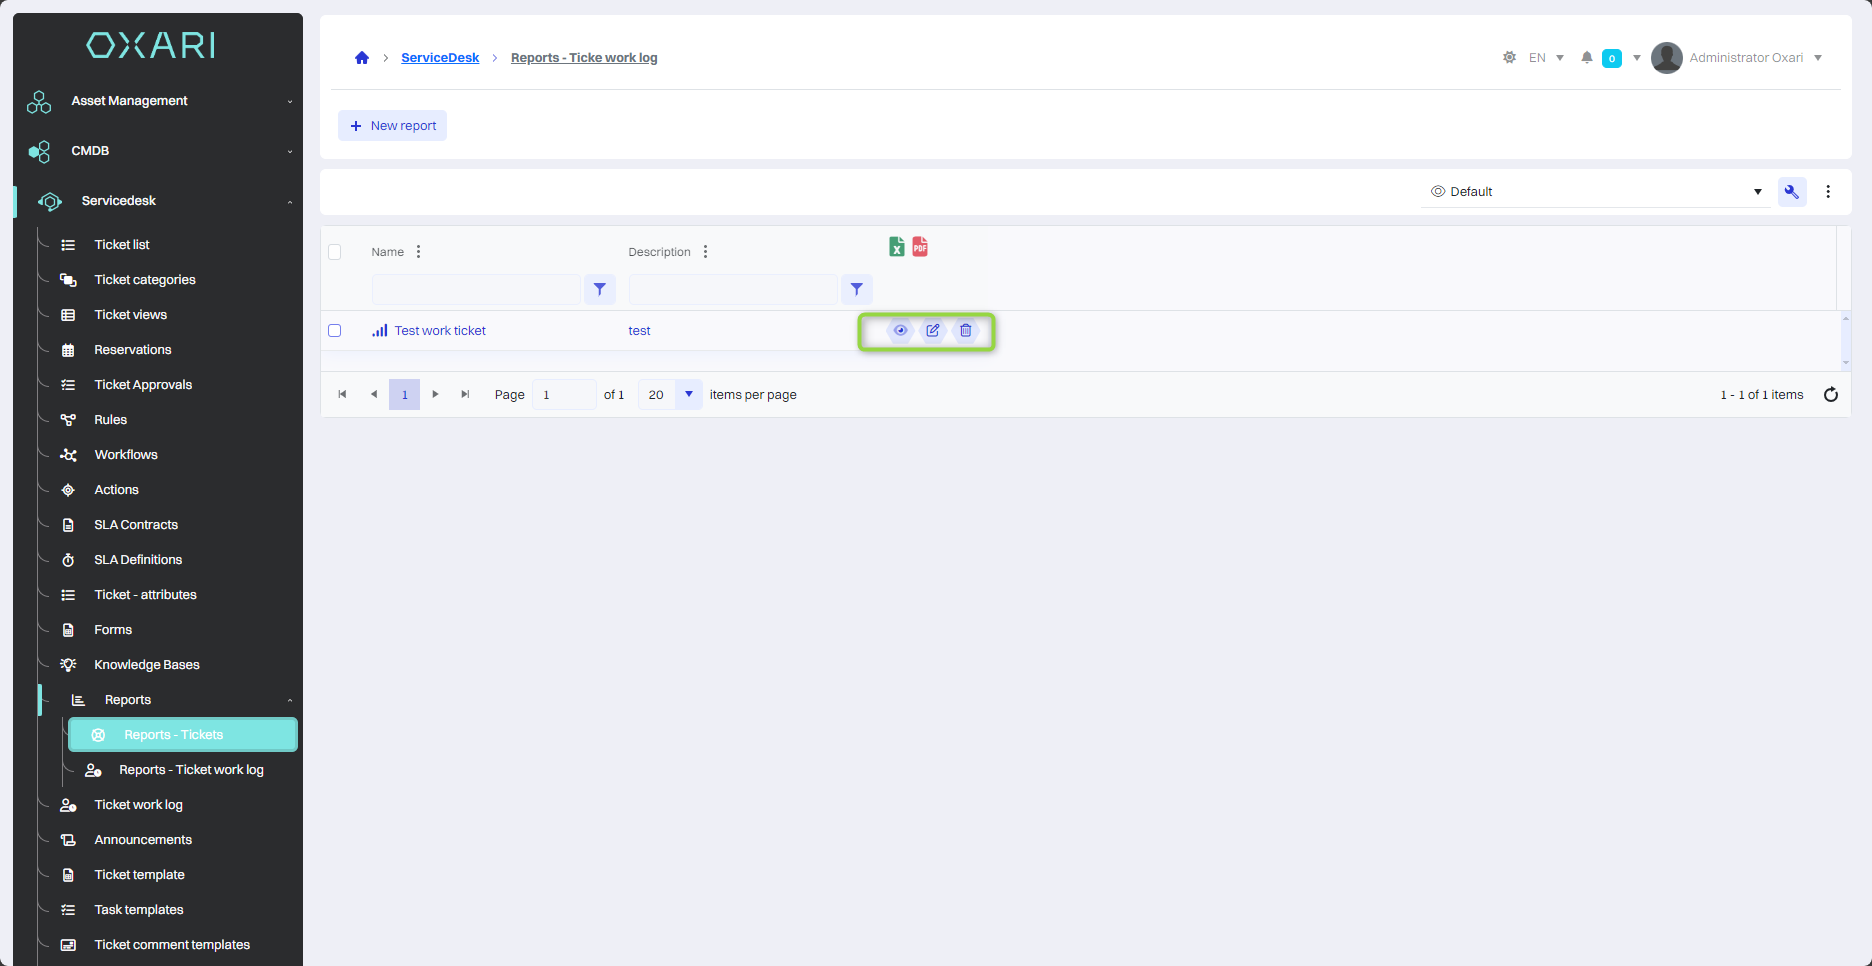
The report, after saving, appears in the table Reports - Work log:
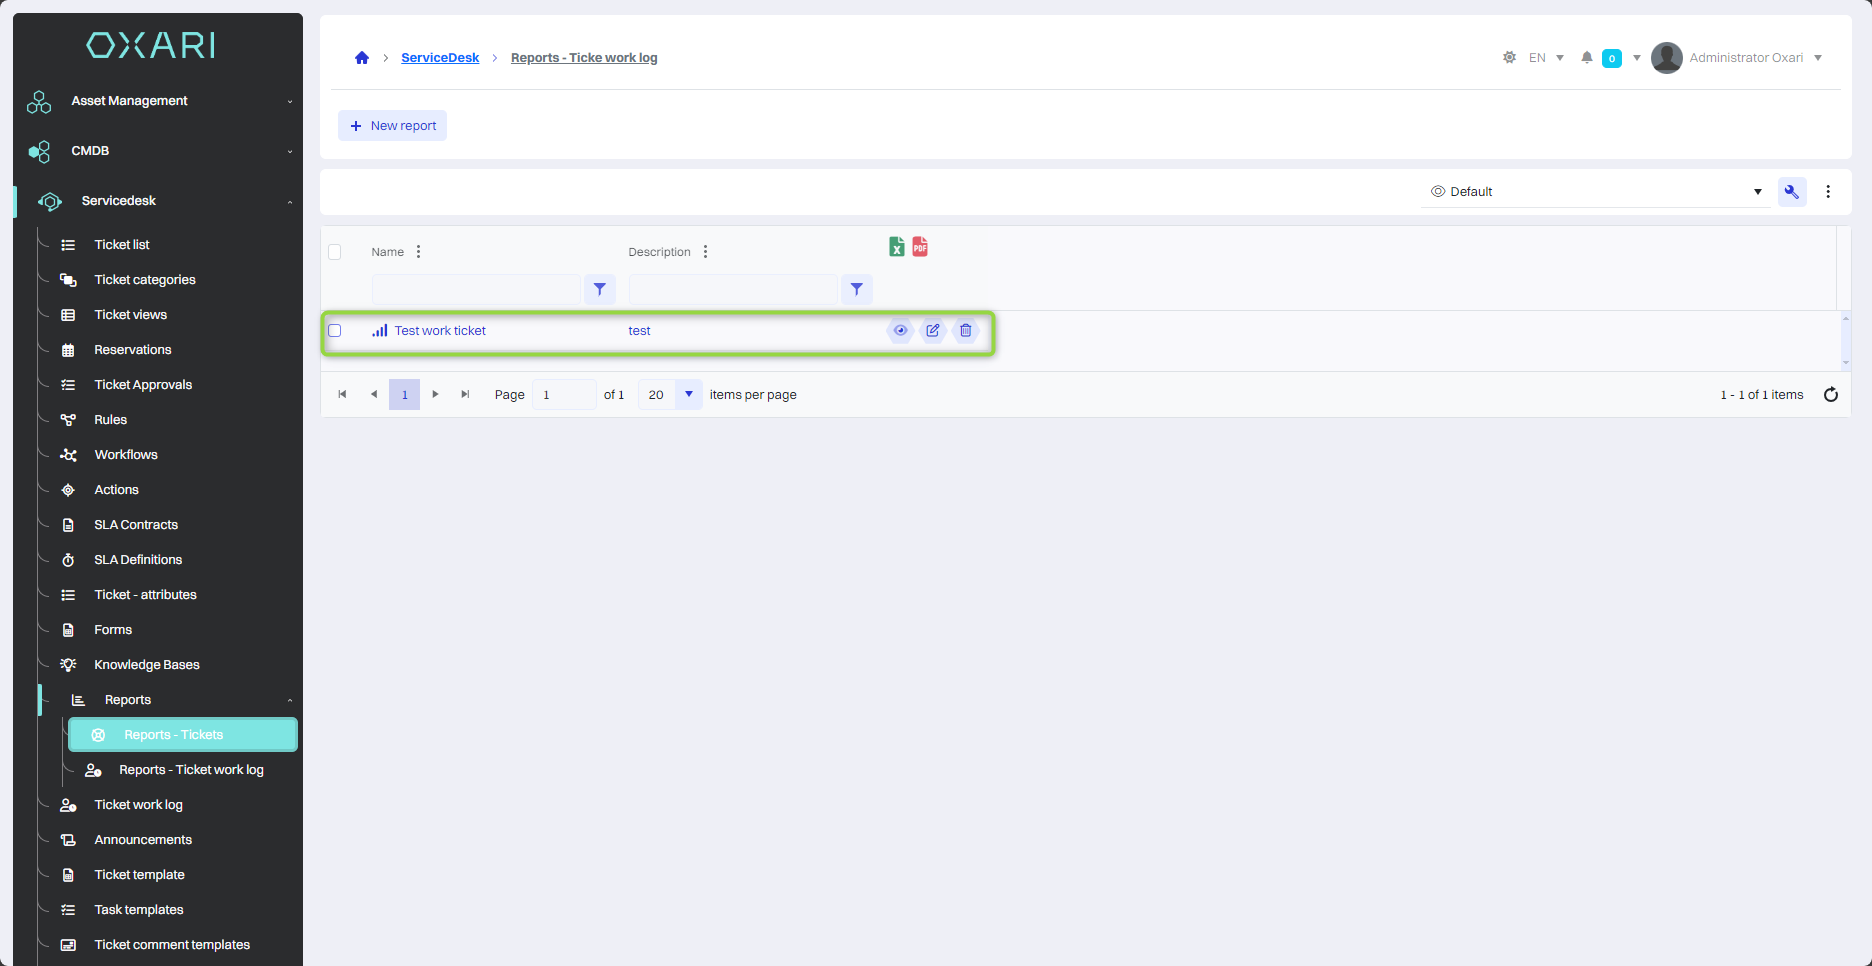
Showing, editing/deleting the report
The report can be displayed, edited and deleted using the following buttons.