Reports in the mobile management section of OXARI are a key tool for monitoring the status of the company's devices. The operating system version report is important for maintaining security and providing technical support. The mobile devices per manufacturer report allows you to analyze the distribution of different device brands. Counts of device activity in recent days and the total number of devices are essential data for mobile resource management. The per agent version report provides information on device management software versions, which supports update and compatibility management.
New Report
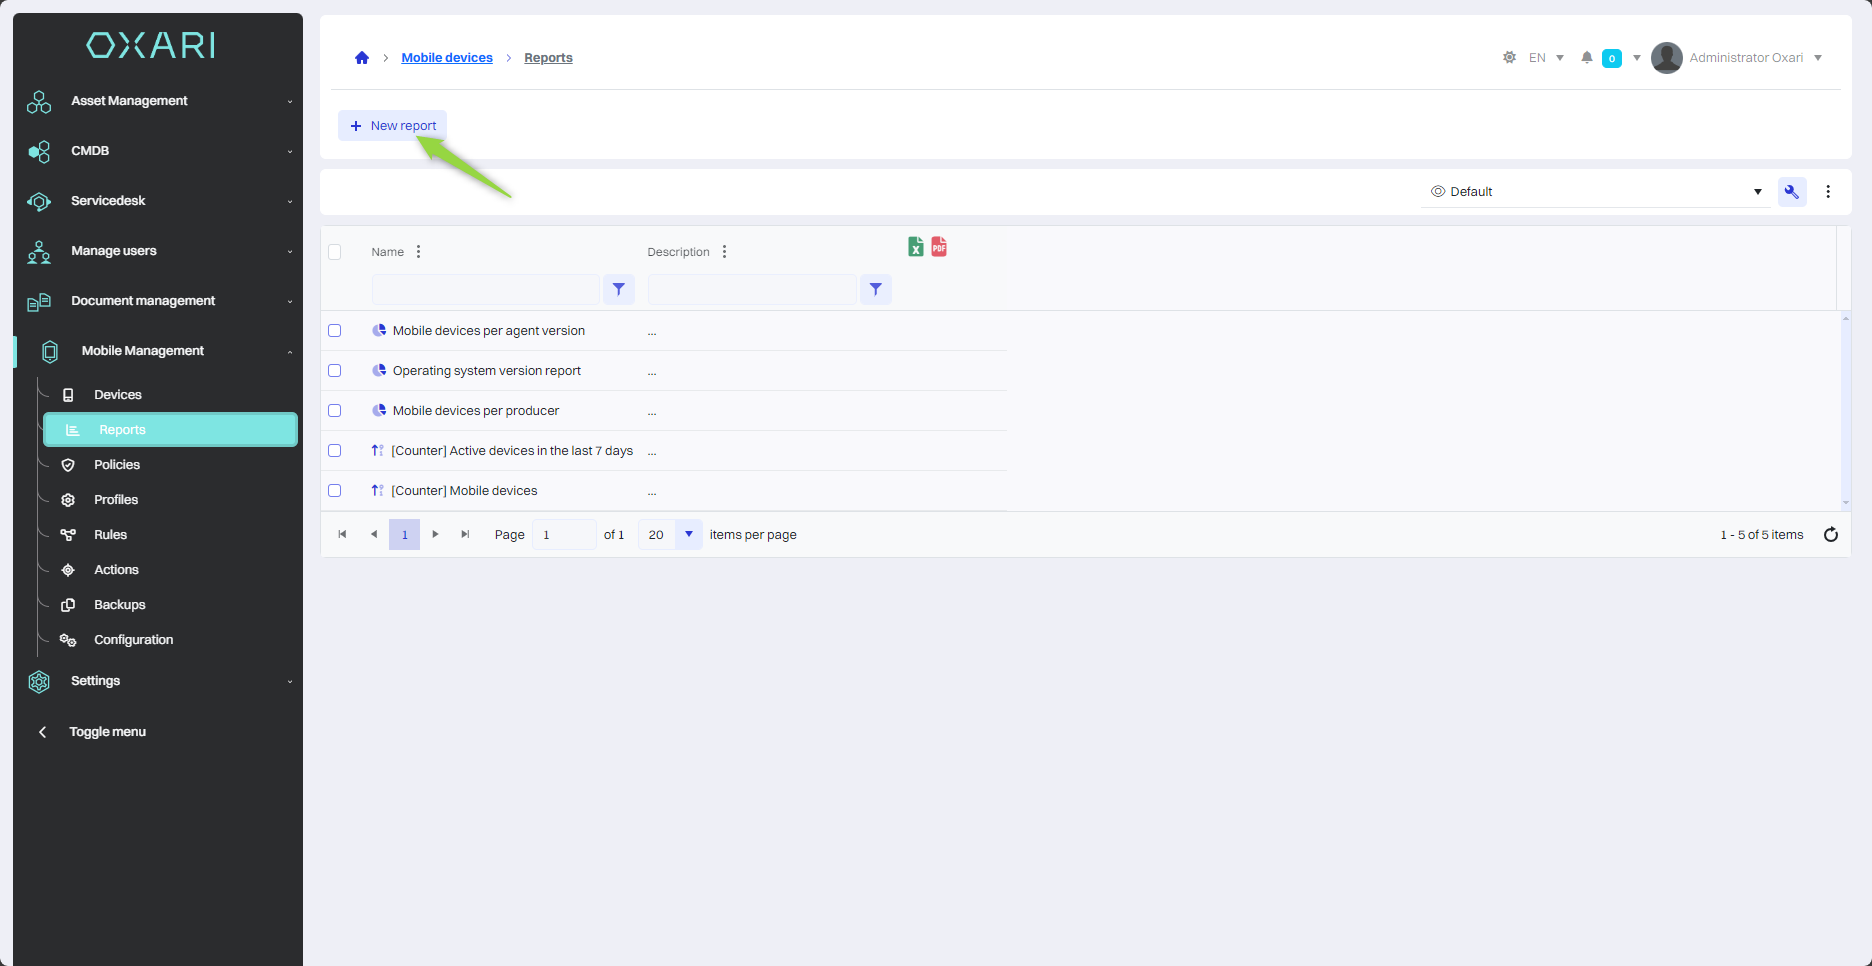
In the absence of an interesting statistic to be presented in graphical form, there is an option to create it. To add a new report, go to the section in question and then click the “New Report” button.
Filling in the basic data
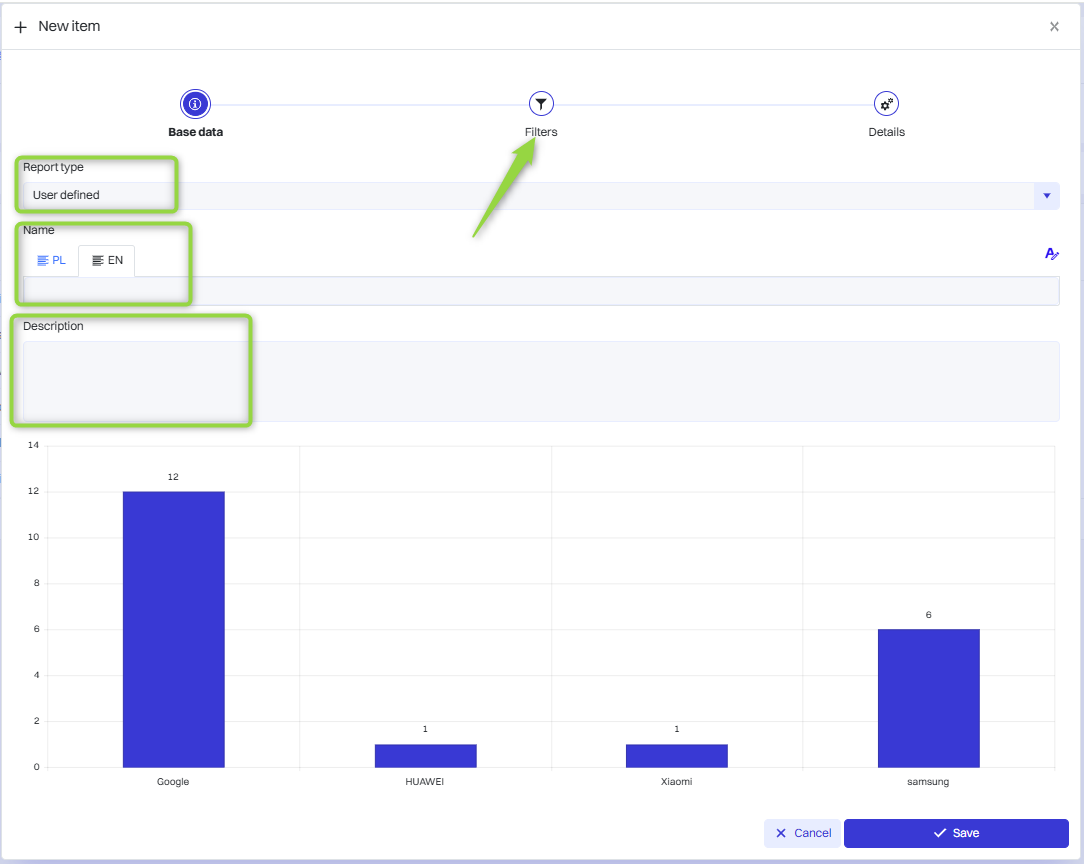
In this step, the basic data are filled in, the Report Type is selected, the report is named and described, then click the “Filters” button.
Establish report filters
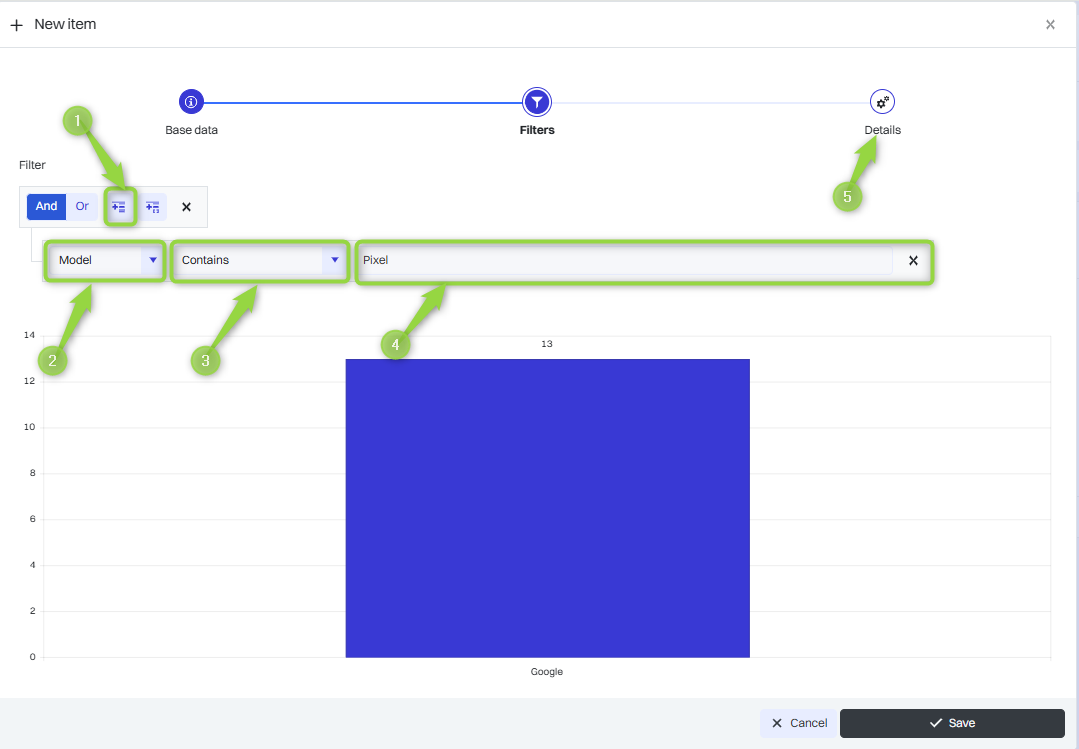
In this step, the filters of the report are established.
1. click the “Add Expression” button
2. click in the field to set the filter (in this case “Model”).
3. the operator is selected (in this case “Contains”)
4. the model in question is selected (in this case “Pixel”).
5. the “Details” button must be clicked.
Below is a description of each filter
|
1 |
Device model - allows you to display data for a specific device model. |
|
2 |
Agent type - filters devices based on the management agent installed on them. |
|
3 |
Agent type - filters devices based on the management agent installed on them. |
|
4 |
Name - allows you to search reports by a specific name. |
|
5 |
Manufacturer - allows you to select devices by their manufacturer. |
|
6 |
Last seen - filters devices based on the date they were last used. |
|
7 |
Operating system version - allows you to segregate devices by operating system version. |
Determining the details of the report
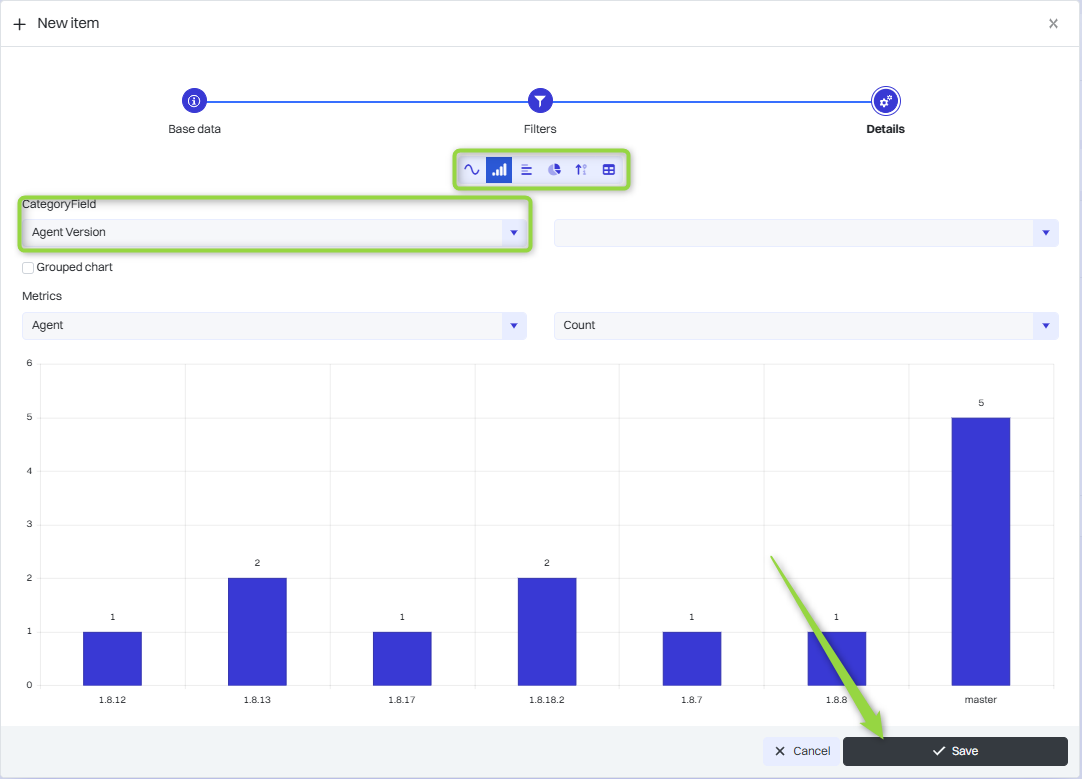
In this section you can select the data category and chart type. Reports in OXARI can be presented in different data visualization formats, depending on the needs of analysis and presentation of information. The available formats are: Line Chart, Column Chart, Bar Chart, Pie Chart, Count, Tabular. Select the desired data and click the “Save” button.
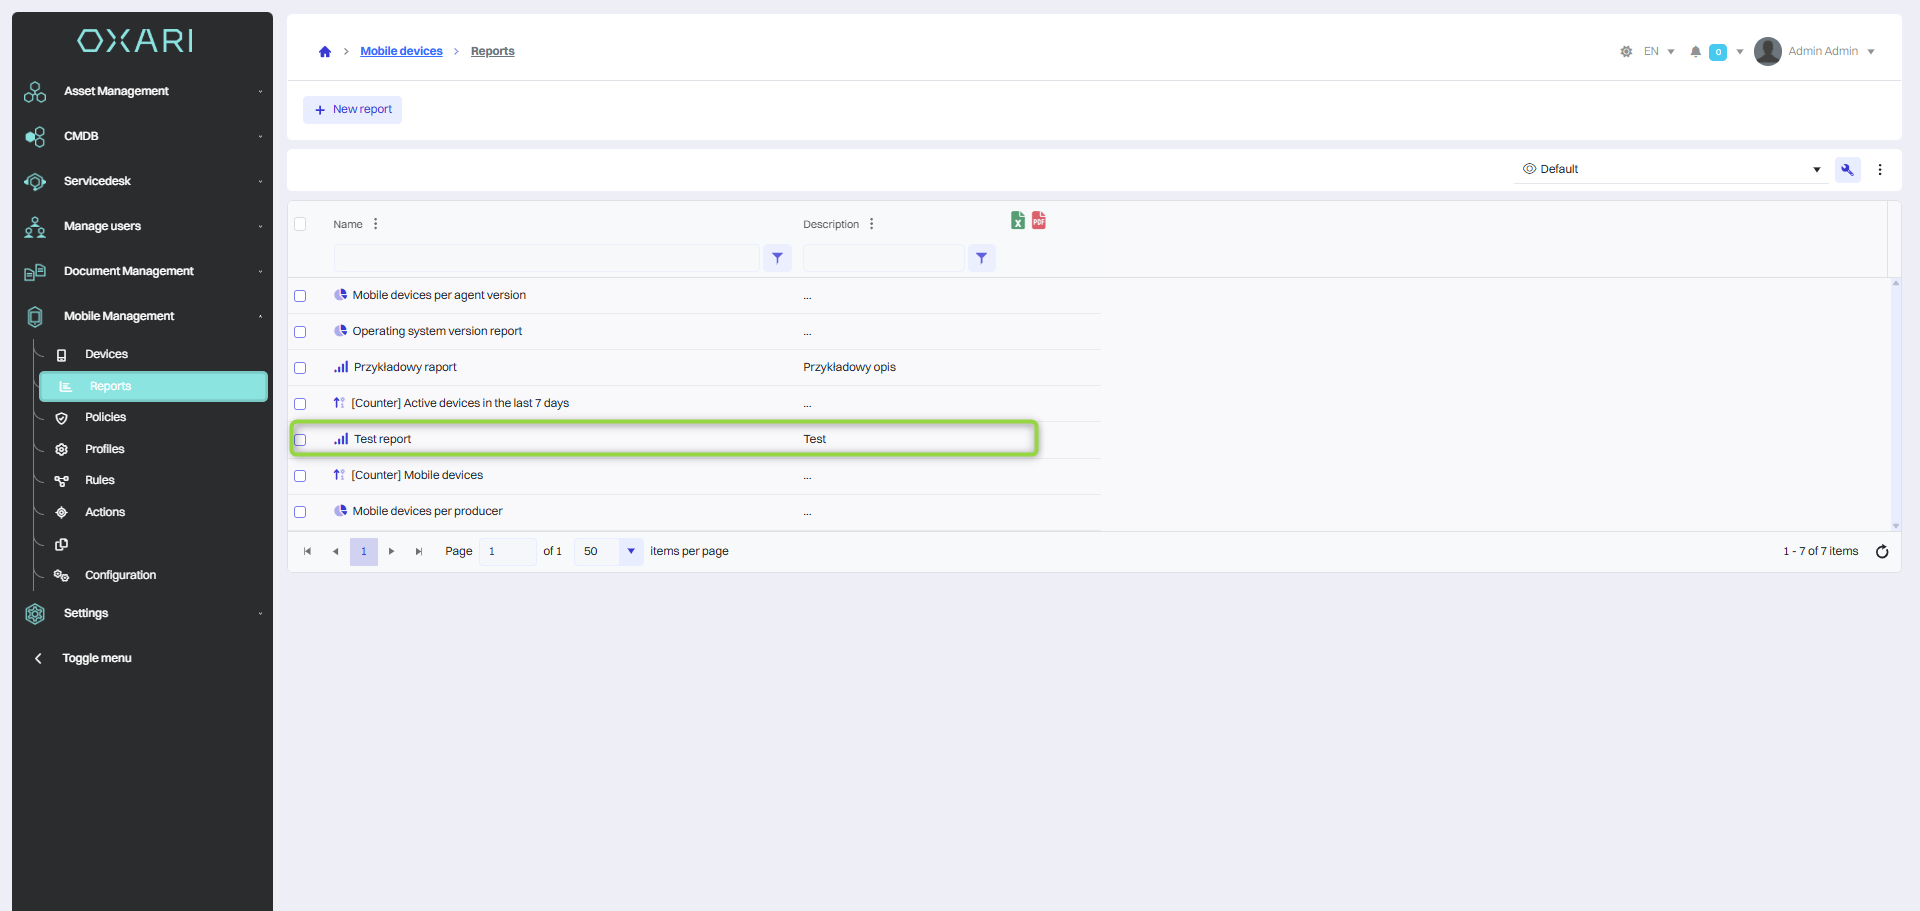
The report, once saved, appears in the Reports table.
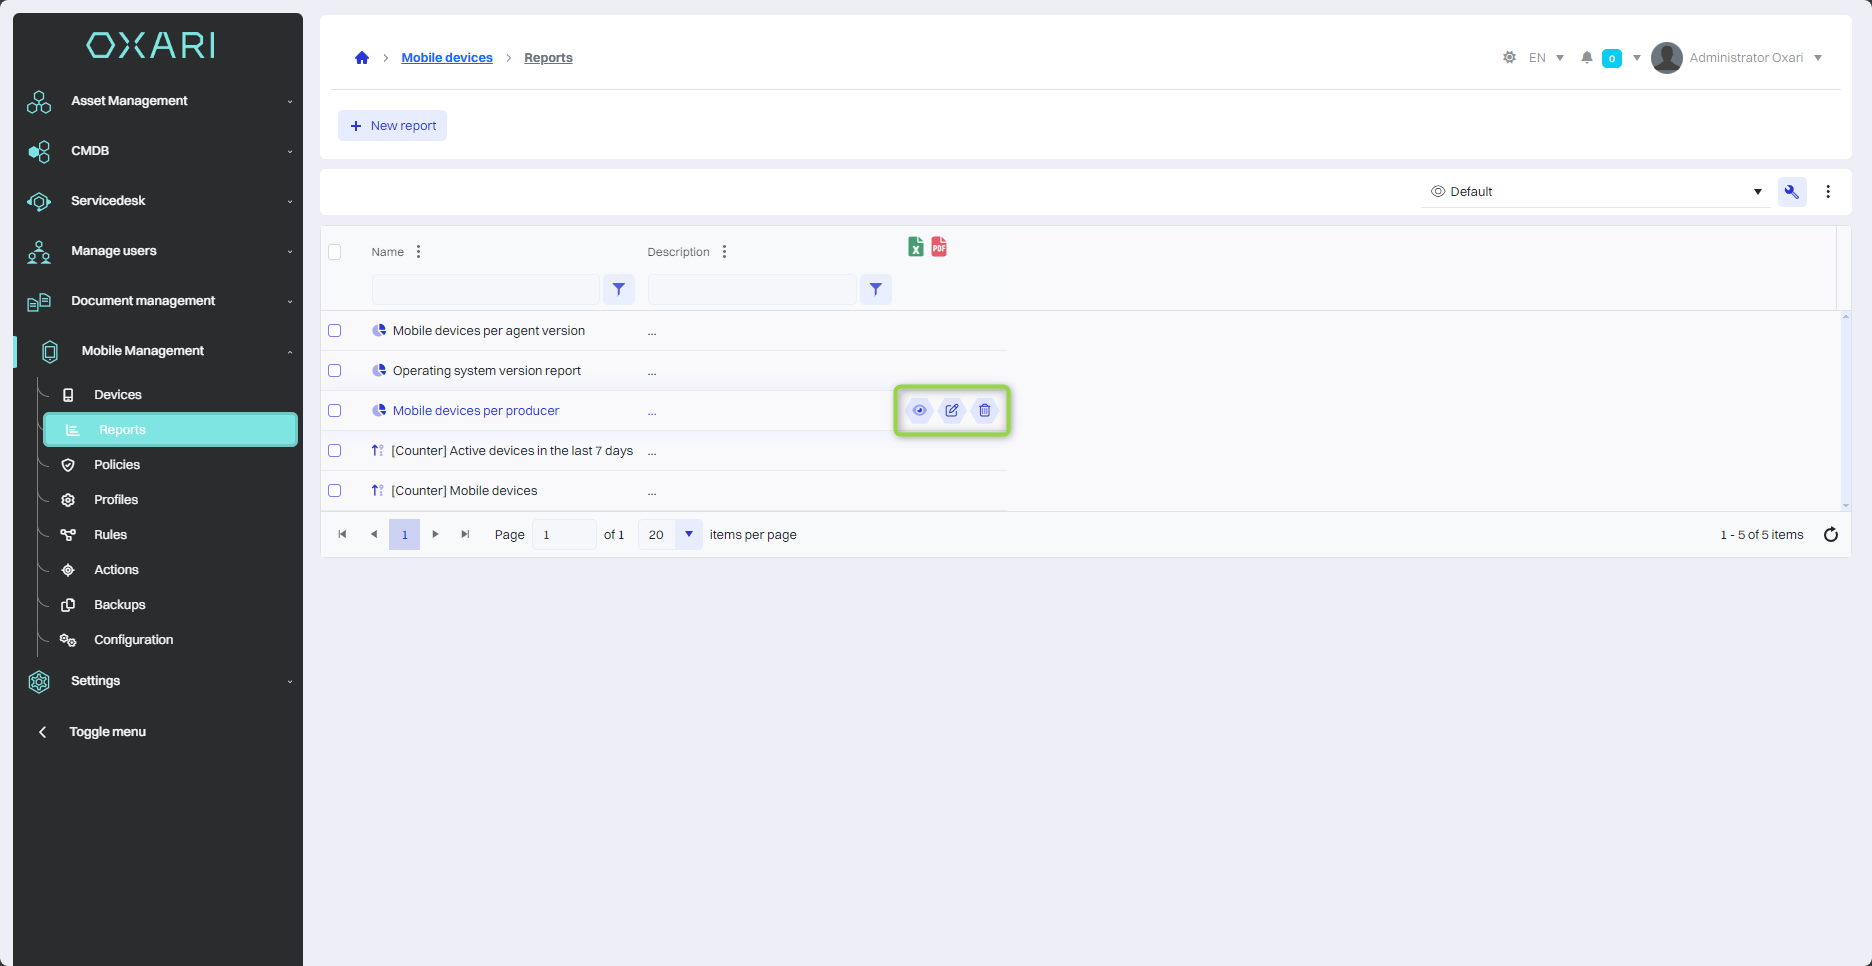
Showing, editing/deleting a report
The report can be displayed, edited and deleted using the following buttons.
Adding a report to the dashboard
Reports can be displayed on the dashboard.
The process is described here: Go >